Snowflake Telemetry in Count
Written by The Count Team
Explore Snowflake telemetry with Count's flexible canvas. Visualize query performance, optimize databases, and enhance data insights effortlessly.
Regardless of where your database resides, keeping track of what is happening in the database has long been a challenge for most database administrators, database developers, and business intelligence architects. Databases grow and change over time, which led to the rise of INFORMATION_SCHEMA as part of the ANSI SQL Standard first introduced in SQL-92.
In addition to implementing INFORMATION_SCHEMA in every database that you create in Snowflake, every edition of Snowflake comes with a ‘Snowflake’ database that has a large number of views that provide all kinds of interesting metadata that augment what can be found in INFORMATION_SCHEMA.
Given the wealth of information available in the Snowflake database, what should we do with it? The initial reaction is to build a dashboard with some of the most interesting information. I have never been a huge fan of traditional dashboards. Most tools implement them in a way that makes them restrictive in terms of both presentation and functionality. Building dashboards has always felt like an exercise in trying to make my data fit someone else’s needs.
The benefit of theCount canvasis that it lets my visuals flow organically and use them to build out the story that I am trying to convey. While your telemetry needs may vary - I’m going to use a fairly generic approach by looking at what queries are running and finding some of the poorer-performing queries so they can be addressed.
Metrics to look into
When looking into telemetry performance a reasonable place to start is run time, which in a consumption-based model is a key factor of cost. Although, keep in mind this isn't necessarily indicative of poor performance.
Some other metrics can be put in place to allow me to start looking at performance from a concrete database perspective and provides clarity around performance issues. For example, when a query spills data, it means that the warehouse has not been appropriately sized for the job.
Let's dive in andstart exploringquery run times and spilled data queries in my telemetry canvas.
Digging into query run times
Setting up the data
Inside the Snowflake database, there is a schema called ACCOUNT_USAGE which contains a view called QUERY_HISTORY. This view contains the same data as when viewing query history in the GUI, and has a wealth of information about the queries that are run on the system [1].
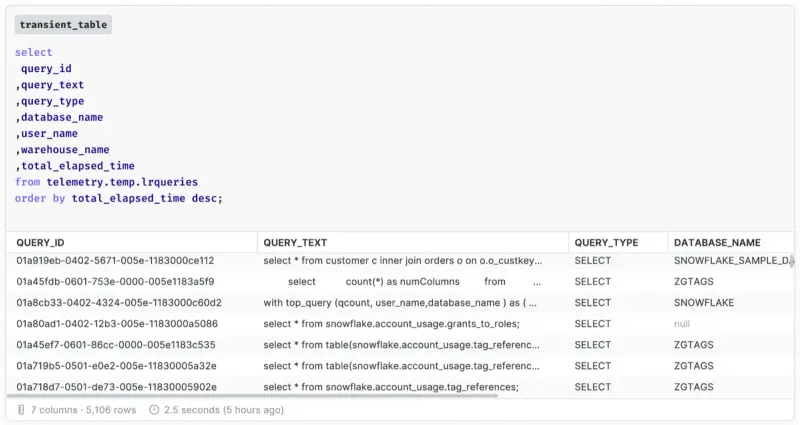
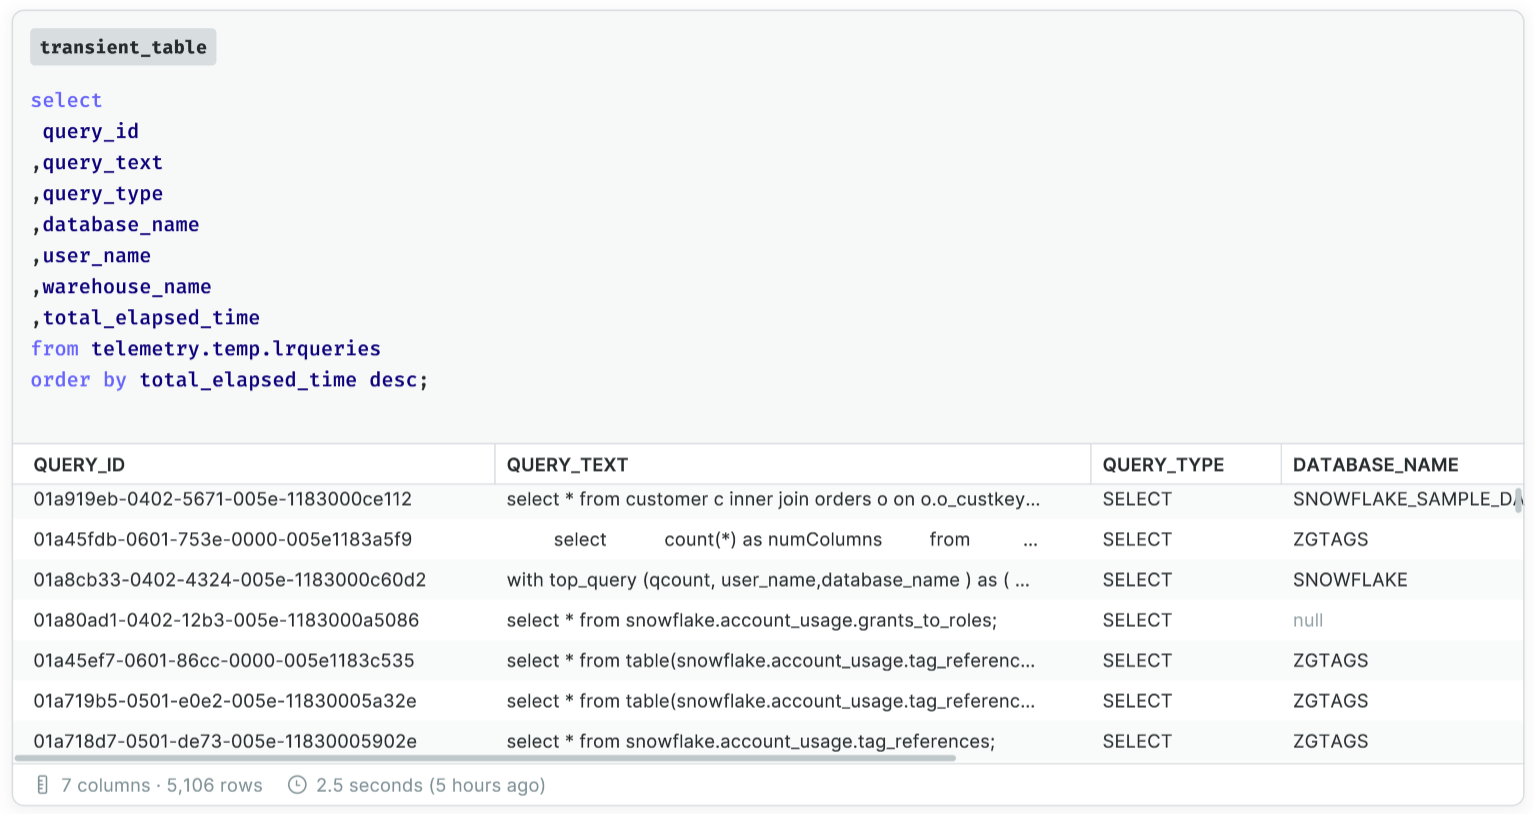
Let’s start by building a transient table that lists some key data around the longest running queries in the account (and again - as I flow my thinking around the initial question or idea - the canvas allows me the space and the continuity to explore that easily enough - which is what makes it ideal for putting this type of information together).
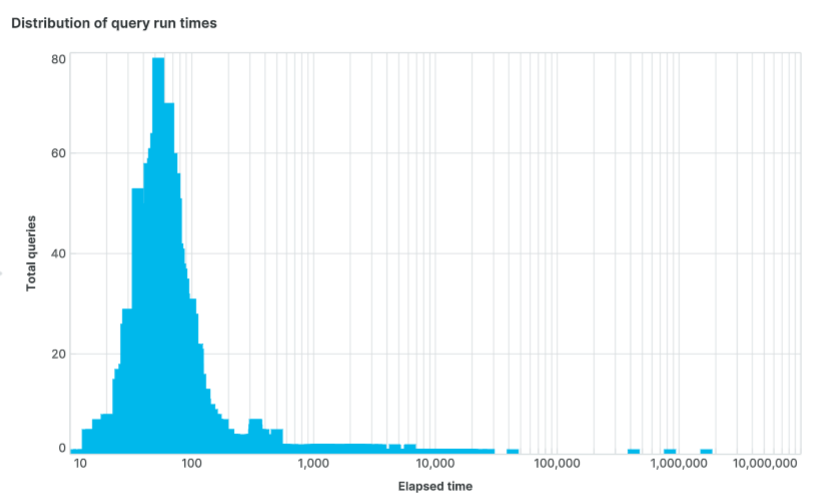
We can use this table to build out an initial bar chart in Count so that I can see the distribution of my queries.
Exploring the data in a canvas
Let’s start by taking a look at our 10 longest running queries to find out more about the outliers. To do this I move down in the Count canvas and throw in another bar chart (or up, left or right - wherever it makes the most sense to me and now I can take this exploration one step further).
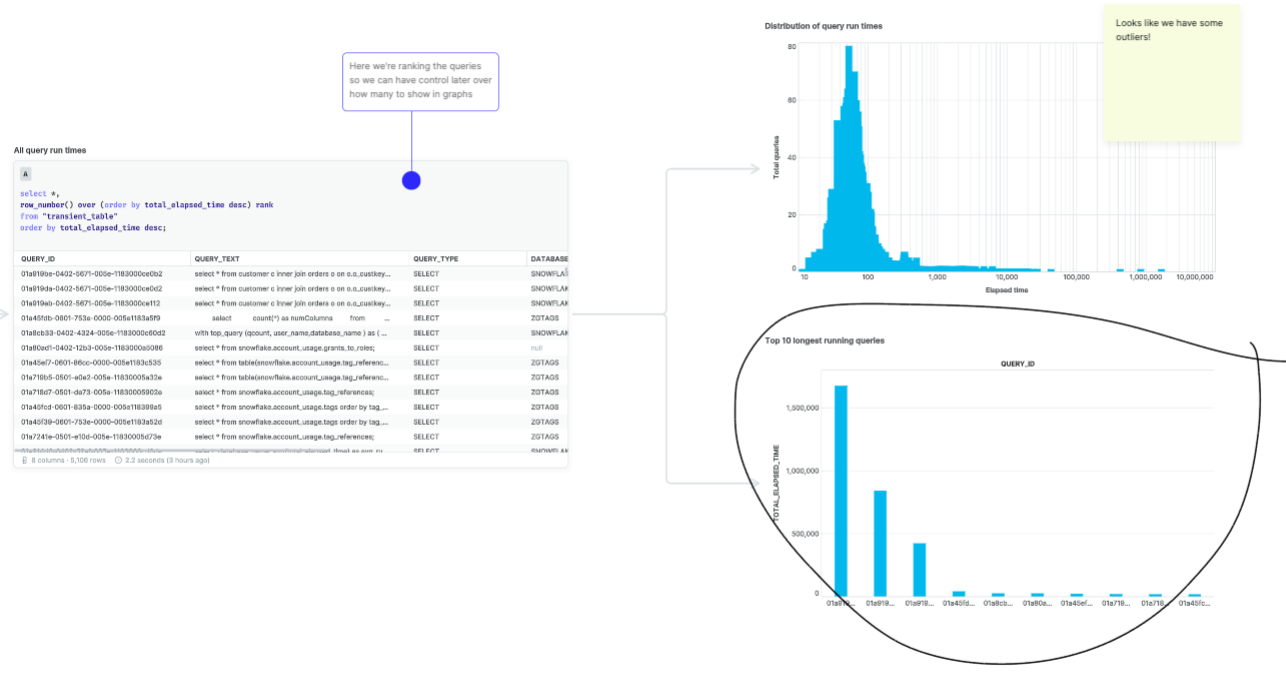
I can change the query so that I can look at long running queries by query type, adding another dimension to the data. This will become increasingly important as we start to look beyond the initial data around long running queries and move into what types of queries might need optimization. So far we have created two visual cells on the canvas that are related and are showing data at two different levels. Let’s reshape the data a bit and look at performance by query type.
Investigating query types
For the next step I want to see what types of queries have the longest run times. This query brings back some pretty interesting results (and again I am likely to use a bar chart here to help me visualize the differences that I am seeing).
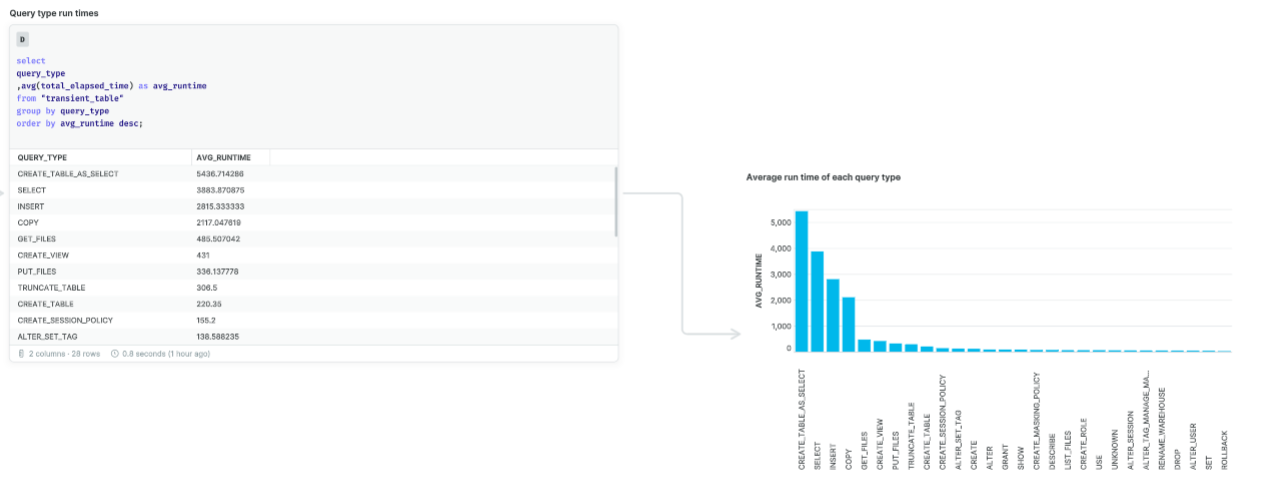
In this case, none of the queries are extremely long running, but let’s focus on inserts for just a second. Long running inserts here might be indicative of a performance issue with my ELT/ETL processes. This might be worth drilling into, especially if the processing windows are tight or there are KPI’s or SLA’s that need to be met.
Query types by virtual warehouses
Another area worth taking a look at is long running queries by virtual warehouses. In Snowflake virtual warehouses are the resources that we allocate to run the jobs. They are t-shirt sized and can also be set up to serve sequential or concurrent jobs (using multi-clustering). How virtual warehouses work is beyond the scope of this post but you can find more information on them here -Overview of Warehouses — Snowflake Documentation.
Here is a query that will return the query run time by virtual warehouse:
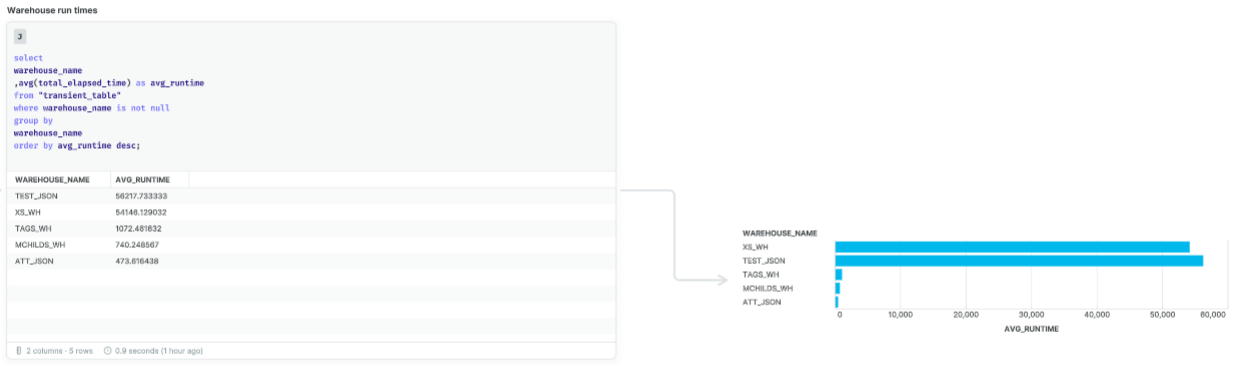
It’s only a small change from the query above, but this is part of the reason that we initially pulled the data out into this temporary table.
This account has only a few warehouses built on it; most accounts will have many more. Null values can be an interesting data point - they show where queries are running that are either going against metadata or using the query cache - so no warehouse is needed for their execution.
Here again we can use a bar chart to visualize this data so that we can see the magnitude of differences between the warehouses. When you see a warehouse that has longer average run times, it might be worth taking a look at the size of the warehouse and what types of queries are being run on that warehouse. If it is a warehouse for reporting, it may benefit from being set up as a multi-cluster warehouse to better handle those types of concurrent workloads.
Query types by databases
So far our initial look at the query history has been at the account level. Depending upon how many databases you have or the critical nature of some databases versus others (i.e. PROD vs DEV) it’s likely worth also looking at the long running queries by database. Again - the Count canvas easily lets me add this to our existing visualizations - and the benefits of seeing this data altogether become apparent fairly quickly (also the way that it flows together allows me to see key metrics that need further analysis).
A couple of quick modifications to our last query allows us to easily take a look at performance at the database level.
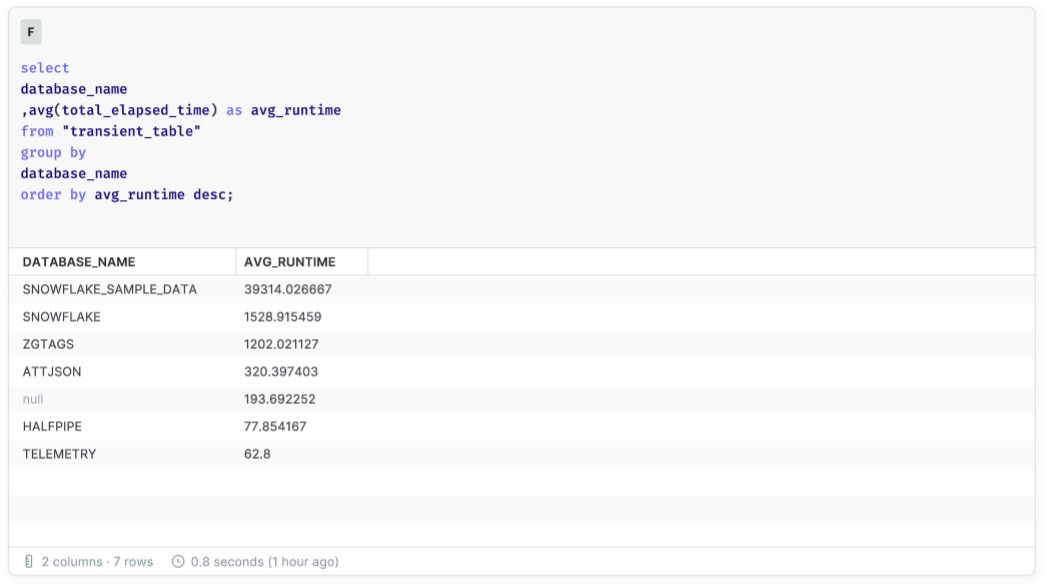
This shows that the longest queries have been running against the ZGTAGS database [2]. However, now that we are at the database level let's add in some more information which I think will allow for a better visualization of the data.
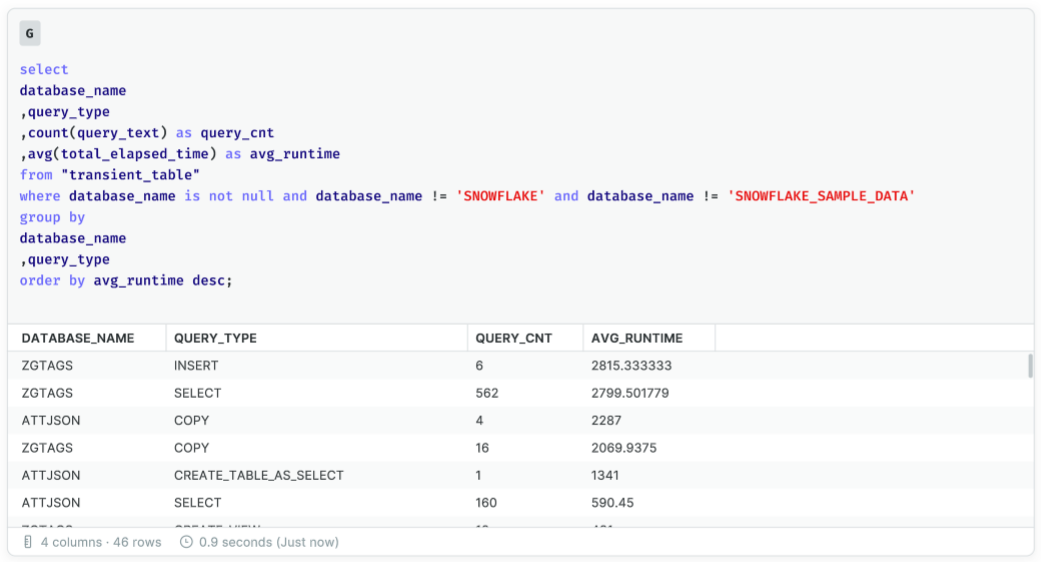
Now we can see that the longest running query type are INSERT statements against the ZGTAGS database. This gives us an initial place to start any investigations if the times associated with these queries are higher than expected.
Spilled data queries
Let’s close out the canvas with one final visualization that has a different data source. The flexibility of the Count canvas is that it allows me to create queries and visualizations from different views and compare them side by side. In this way, I'm able to build out a new set of visualizations that complement the ones we already have and add yet another dimension of data to look at.
I mentioned earlier that another aspect we should look at is spilling around the queries. This typically means that the virtual warehouse is not sized appropriately [3]. For this data we will go back to the QUERY_HISTORY view and pull the data directly from there.
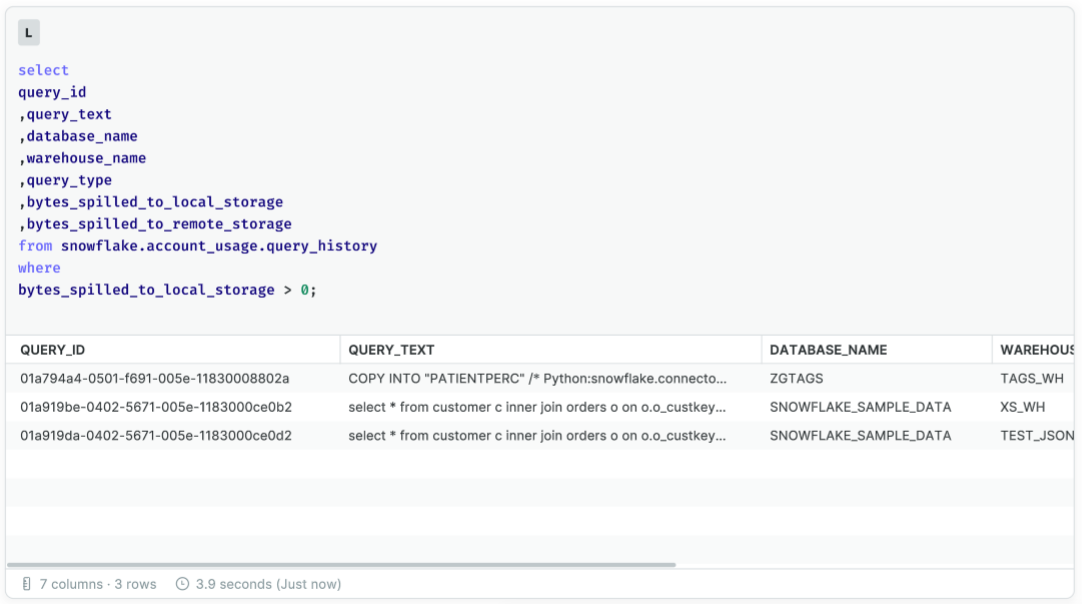
What makes this final cell unique is that your overall goal is for it to be empty. It should serve as an alarm on the Count canvas as any query that is spilling needs to be looked at and likely have some mitigation applied to resolve the issue. The canvas allows for this type of flexibility where the mere presence of a populated cell or visualization can serve as a notification for something that needs to be addressed immediately.
Conclusion
The QUERY_HISTORY view only scratches the surface of the telemetry and metadata capabilities in Snowflake, and the Count canvas is a perfect place to explore building out the telemetry you will need to monitor your Snowflake instance. The flexibility provided by the Count canvas allows for a full interactive exploration of the underlying information and then allows you to highlight specifically what will be helpful for your organization. Instead of having the data siloed in specific dashboards, you can have parts of the Count canvas that are dedicated to certain aspects of the data. It’s like having a data map that you can move around on and explore.
This is not the traditional way of looking at this type of data, and I think that is what makes this such an innovation. Snowflake is a different way of managing your data workloads and Count is the perfect complement to that, bringing fresh new ways to explore and share the data, and most importantly bringing much needed collaboration to this space.
Click hereto explore the canvas discussed in the article and follow allow with your own telemetry data.
[1]It can take longer for information to replicate to the ‘Snowflake’ database - so this needs to be taken into consideration when you look at using it as a source of telemetry.
[2] You can manually exclude the Snowflake and Telemetry databases from the query. Their counts are escalated here because they are being used extensively in the development of this article.
[3] It can also mean that a poorly written query has made it past testing and is causing cartesian or exploding joins - so it is always good to look at both the warehouse size and the query itself.