How to build a Canvas - a data analyst perspective
Written by The Count Team
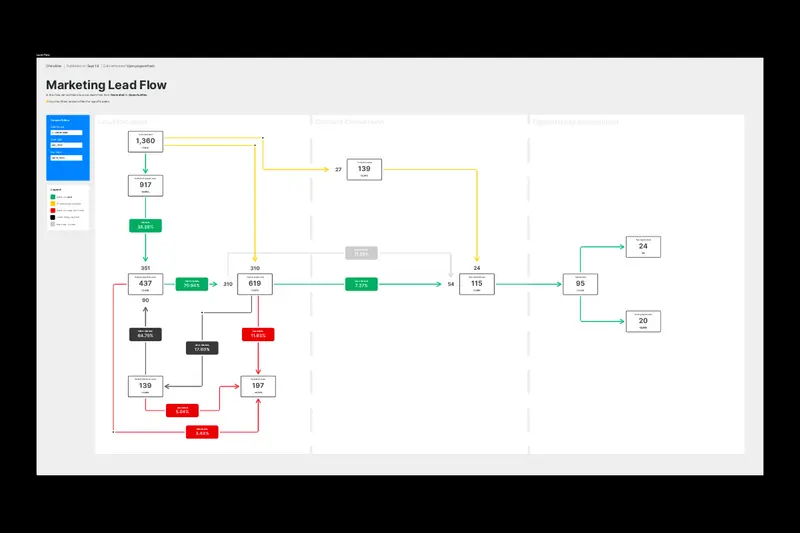
"Master canvas creation for data projects with a step-by-step guide. Enhance collaboration, streamline workflows, and visualize data effortlessly with Count's flexible digital whiteboard."
Building a canvas can seem easy enough, but like everything in the world of data, it can quickly get out of hand. Bouncing between ideas, changing data and shifting requirements can derail any project. Let’s make your next canvas a success with this step-by-step guide based on an actual marketing funnel I built.
What is a canvas and why I choose this over traditional BI
I’ve been using Count for over a year now, starting with the notebook and moving into the canvas. Everyone has their own idea of what a canvas is in Count. When telling someone who is new to the concept, I tend to say it’s a digital whiteboard that I can put real-time data into. Think Miro with a SQL IDE and visualisation engine to boot.
The benefit of having a SQL-powered BI tool with the flexibility and freedom of a design tool like Figma really sets it apart from other traditional BI tools which are far too restrictive. The ability to work collaboratively is huge in helping to streamline projects that usually involve multiple rounds of back and forth between different stakeholders. Count allows all of us to work in a single Miro-style whiteboard document which ultimately becomes the report for the final deliverable too. You can do it all in one place.
5 step guide to building your first canvas
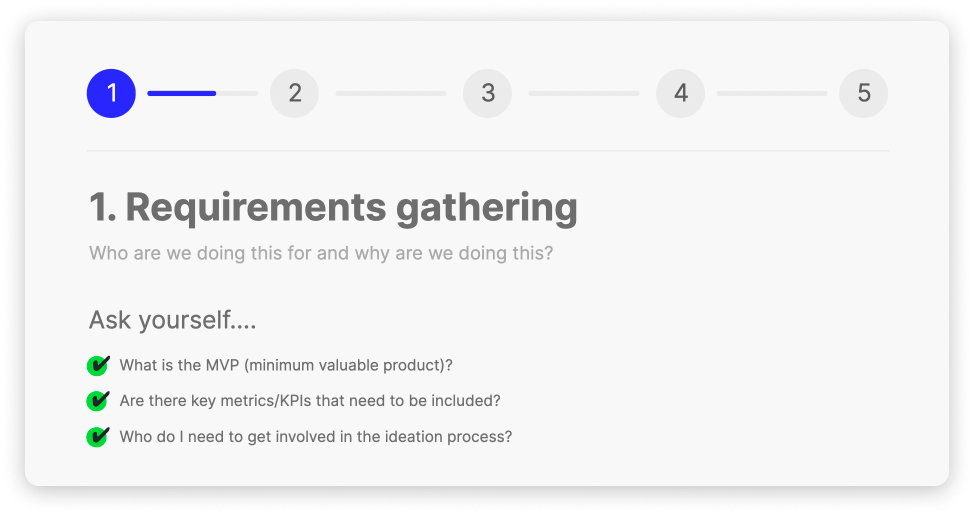
Before thinking about the specifics of the design, layout and data, we need to focus on the user. That means we need to get a complete picture on who they are, what they need, and how they need it.
Based on the learning from the above, we can start answering better questions, such as why are we doing this? Are we monitoring something over a period of time? Are we letting users interact and learn things themselves? Or are we answering a one-time specific question? All of these would produce significantly different outcomes.
To show you this process in the real world, I’ll use one of my canvases’ as an example. The users were Marketing and Sales Leaders. The team wanted better visibility into the lead funnel, all the way from generation up to opportunity creation.
This gave me several items to think about;
- What is the MVP (minimal viable product)?\n\n
- A funnel to show leads moving from one stage to another.
- Are there key metrics/KPIs that need to be included?\n\n
- We needed a count of all the leads reaching specific stages and also the associated rates of one stage moving to another.
- Who do I need to get involved in the ideation process?\n\n
- This was pretty simple, the marketing team and sales operations team were directly involved in helping plan.
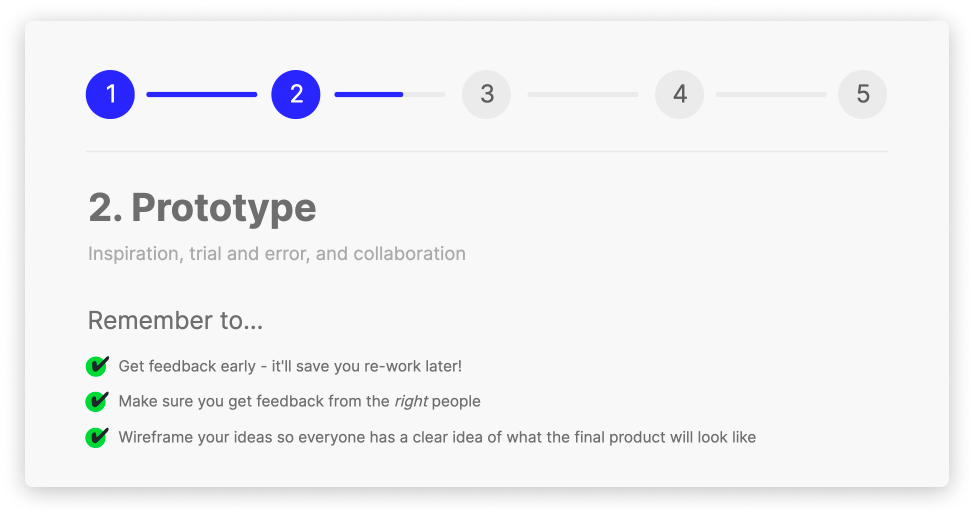
Once you have gathered enough information and know who you are going to be working with, it’s time to start prototyping. This is where the process may be different from building a dashboard. You would likely still come up with ideas and prototype, but this would usually be on pen and paper or in design software or (gasp!) Excel, whereas in Count this work will be used in the final build! This is one of the strengths ofCount.covs other tools. You don’t have to have your data ready to go while you’re wire-framing and thinking of ideas and your wire-framing/layout will actually be used in the final canvas. There's no wasted work.
Realtime collaboration
While you’re prototyping, get the potential users of the canvas in Count, helping with ideation and wire-framing. This benefits the project with better management of expectations and helps facilitate feedback through the process.
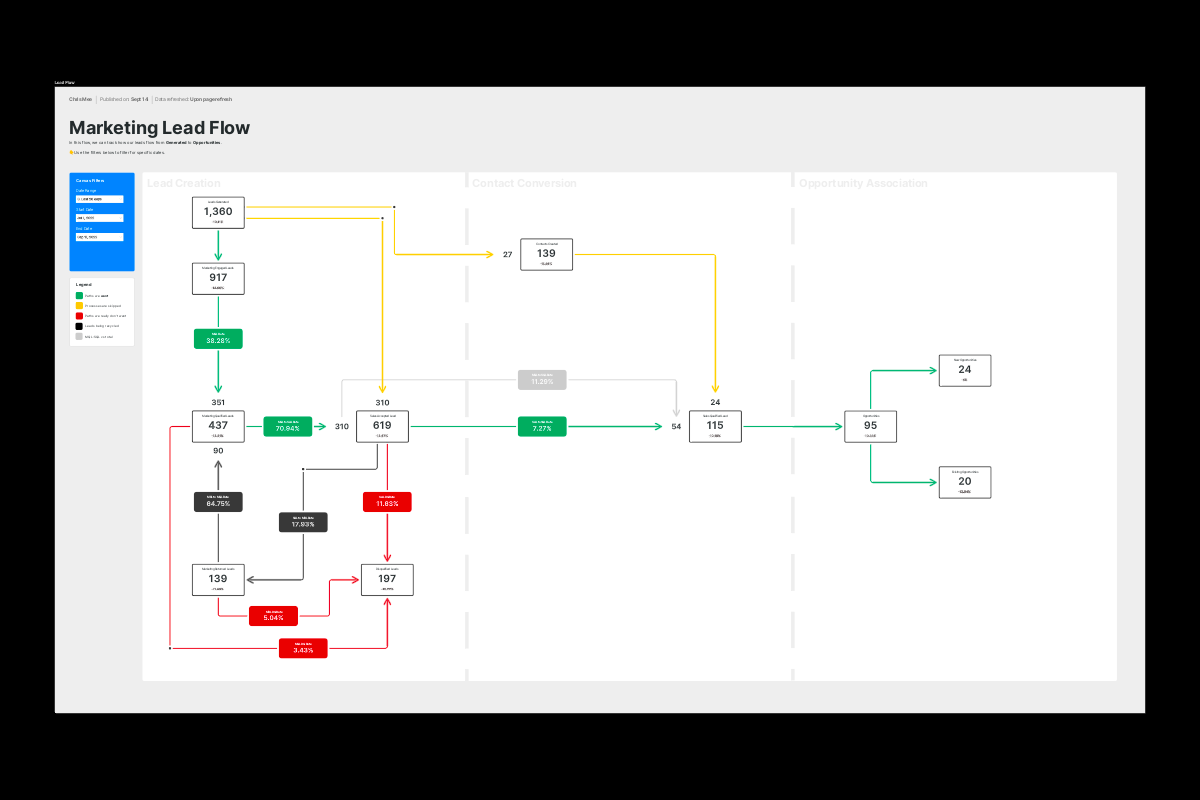
With our project, we started off with this simple layout to mimic the funnel the company had been collecting data for. We chose to use a flow rather than a funnel for a few reasons:
- Easier to swap and change our stages/metrics if they change over time
- There could be a lot of nuances with stages being skipped, that is hard to present in a traditional funnel
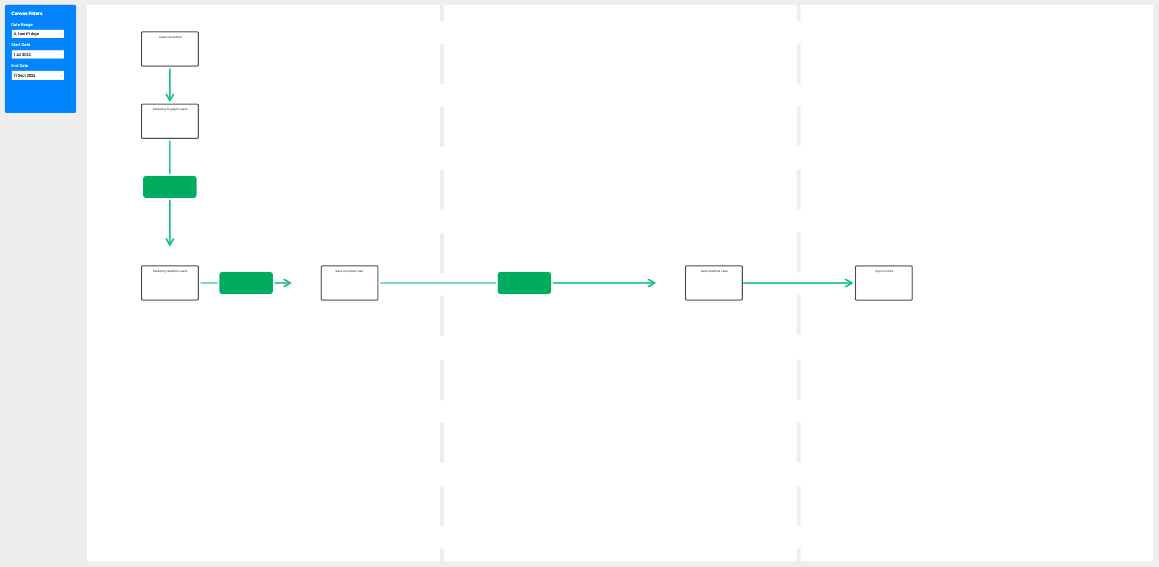
Once we had this basic idea, we started working together to figure out the nuances in our funnel and add steps and flows to take everything into account. Which stages can leads skip, what happens if a lead is returned to marketing vs disqualified etc.
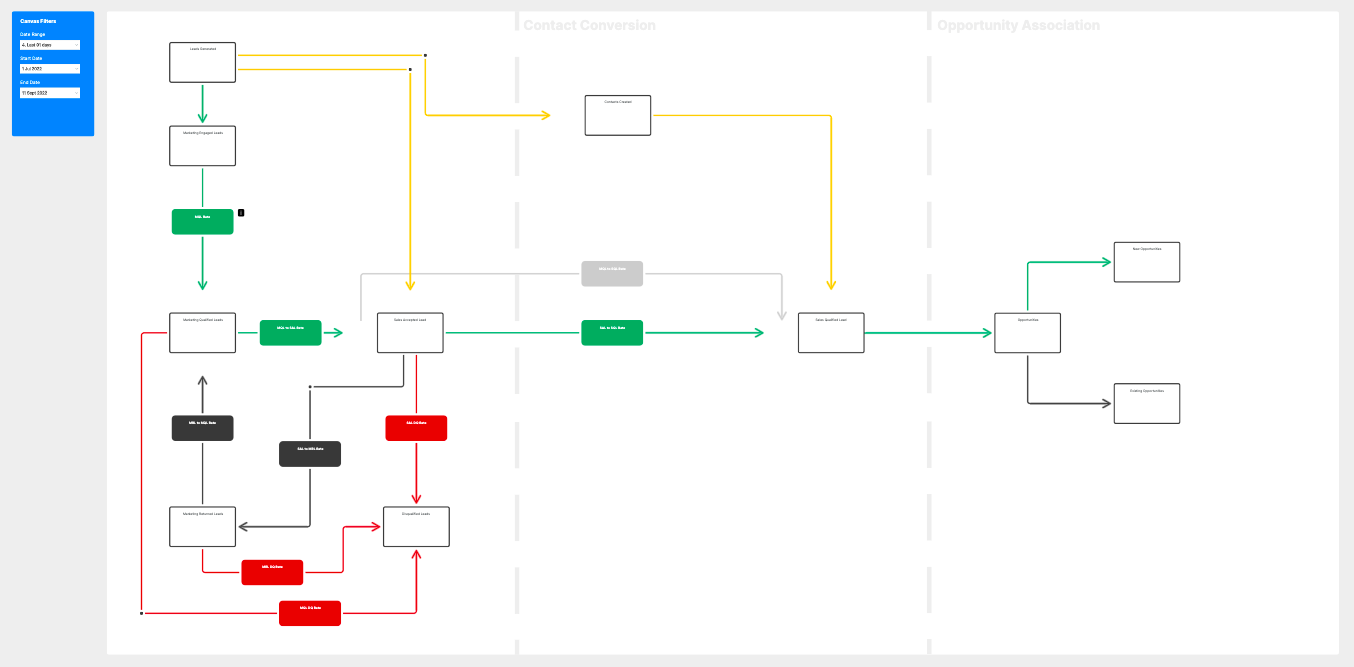
After a few iterations and discussions, we eventually ended up with our desired layout with all the KPIs that the team cared about included.
Based on your prototype, you should have a good idea of what data will be required to fulfills your plan. We are not going to go through the SQL I wrote for the canvas. However, this is the time I would get all the SQL organised and transformation/analysis complete.
Instead I’ll go through some tips to help managing your workspace and helping organise and laying out your canvas with this many BANs (Big Ass Numbers).
Frames are your friend
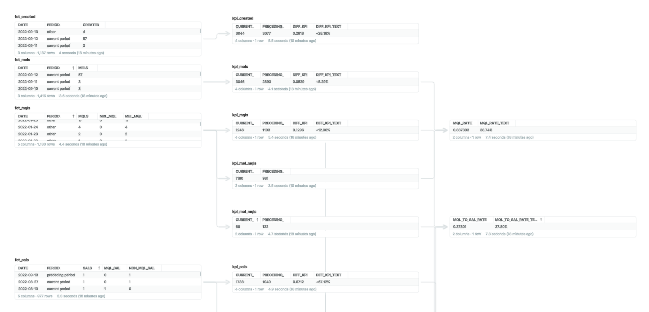
Frames are great to organise all the queries you might need, this specific canvas had three different sources of data that needs transformations as well as analysis frames for the KPIs and visualisations.

Keep a SQL cell hierarchy
Below is an example of what one of my frames looked like. The idea is to create a ‘common-sense’ hierarchy with the cells you are creating. Due to the structure of the source data and the need for separate BANs across the canvas, it really helped to keep all the data consistent, streamlining the query creation as I knew the query above was almost identical with just a few small changes.
Additionally, I always hide the SQL code input when the cell is not in use. This lets me keep track of where I am currently working (the cell with code showing) and let’s be honest, it looks significantly cleaner; especially when I have cells right above and beneath one another. However, remember to give a name to your cells that isn’t the sql name, so that you can quickly identify cells without the need for the input window.
Object names
With this many cells, visualisations and source data, naming items so that you can reference them later on is pretty important. Try and stick with a naming structure so it’s easy to find what your looking for.
My naming structure:
type of object_name of object
This means if the cell is bringing in the source data from the database, it’ll be called something like:
source_leads
If the cell is doing some data transformation on the source__leads cell, i’d call it:
query_leads
If I have a visualisation generated from the query__leads i’d call it:
viz_leads_over_time
This saves a lot of time if later on you have a lot of cells!
BANs
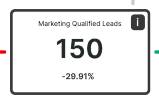
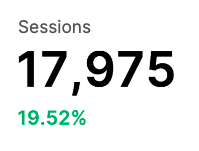
BANs are super useful, easy to create and should be used when you need a large summary metric to focus someone's attention too. Here are some tips when creating a BAN:
- Keep it simple, left aligned for standalone numbers, centre-aligned for neatly packaged KPIs.
- Create one BAN and then duplicate that to ensure your sizing is identical across each KPI.
Connectors
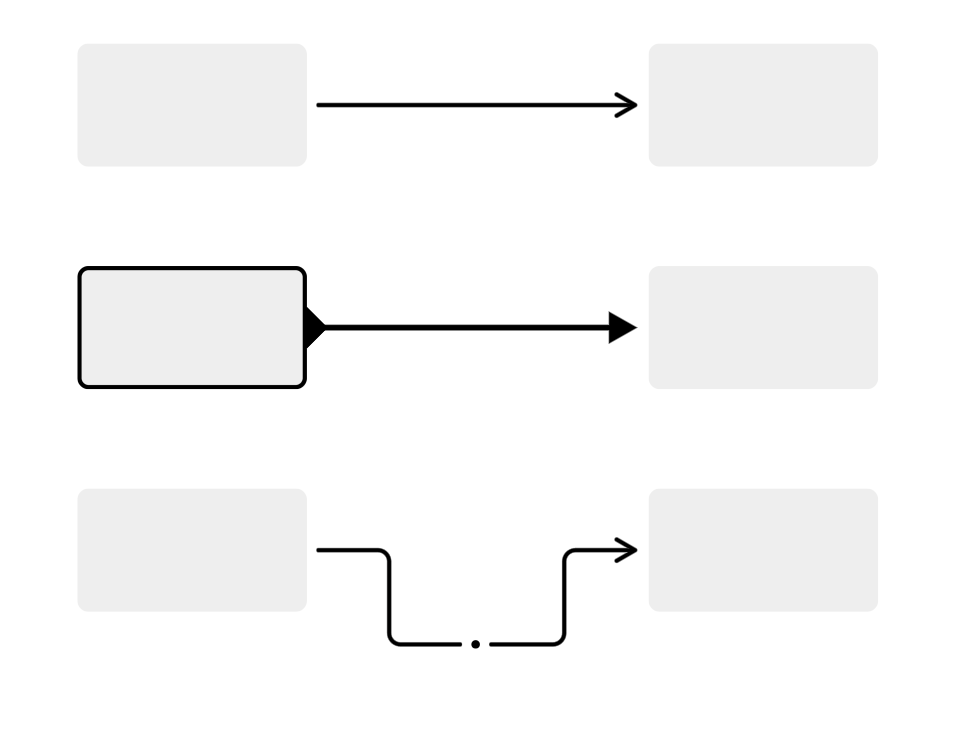
A recent update to Count allowed the use of connectors between different objects. These are great, especially with a flow. Here are some tips to make them work for you;
- Add an additional shape object to the end of a connector to make a seemingly direct connection to another object instead of floating next to it.
- Use an additional shape object to add an anchor point. This will allow you to make a connector flow a specific direction if the automatic routing doesn’t look right.
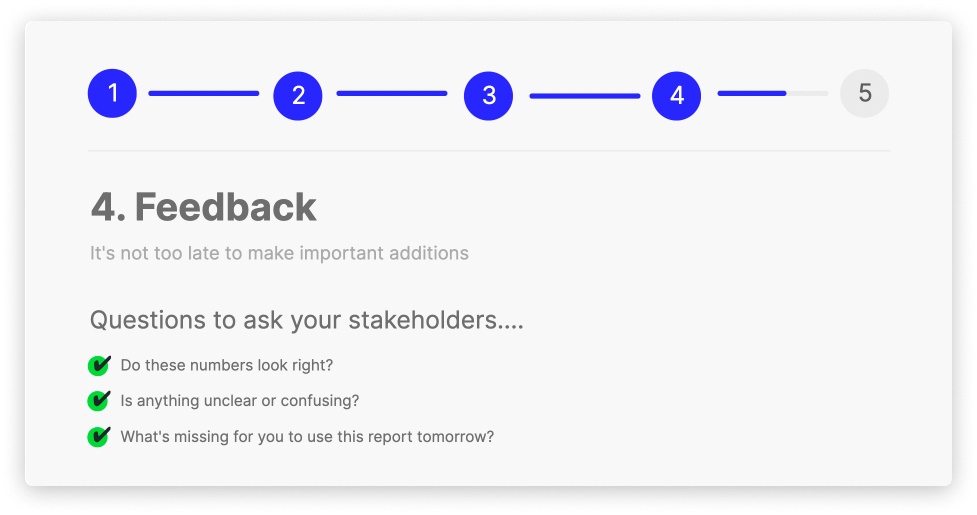
By now you should be pretty far into the development of your canvas. This is a great time to soft launch. Ask your collaborators to test and give honest feedback about usability and usefulness. This needs to work for them so it’s better to get feedback directly from the target audience.
This will give you the perfect opportunity to to do some quality assurance. I personally quality check my analysis by running some queries to mimic the data in the canvas directly into our snowflake IDE. This allows me to double check the analysis/transformations that exists within the canvas, allowing me to identify any miss-match of data.
This is what the lead funnel looked like at this point:
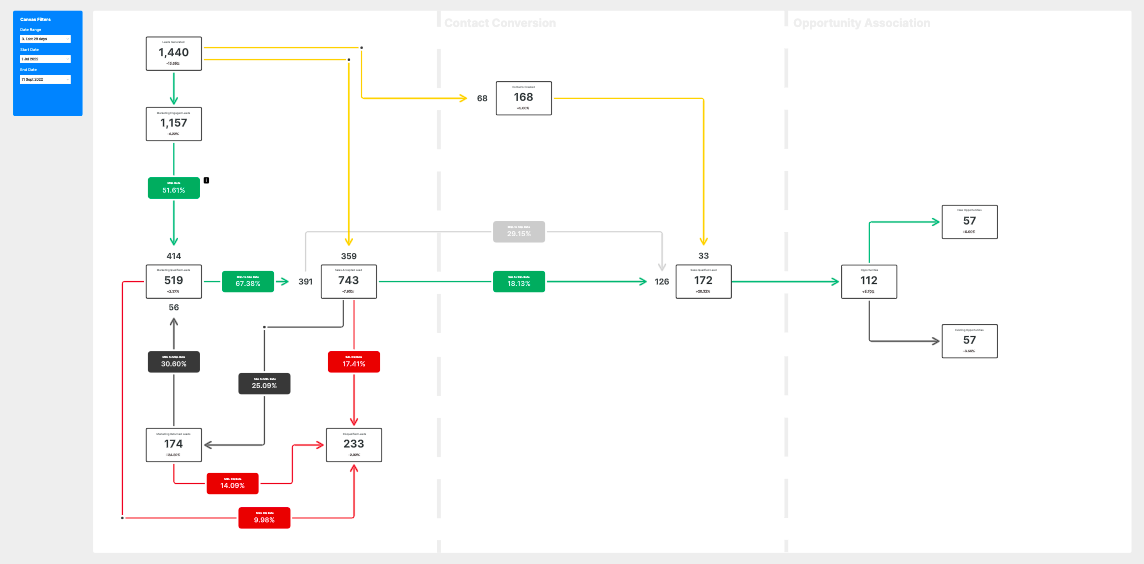
During the feedback sessions, we identified that the canvas and specifically the data being presented within the flow made more sense to people who were directly involved in the management of the lead process. To other users, it was quite confusing and hard to focus on the most important aspect, the movement of net new leads to sales qualified leads.
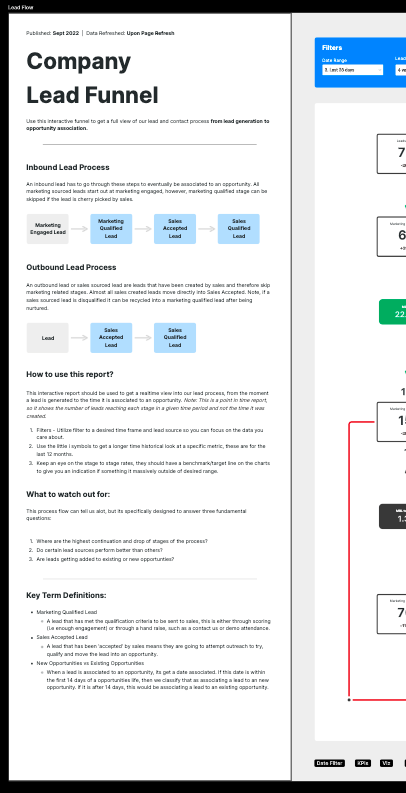
Based on this feedback, we identified a need to add additional information (Thanks toTaylorfor the layout idea here):
It’s time to announce the general availability to all users that can have access.
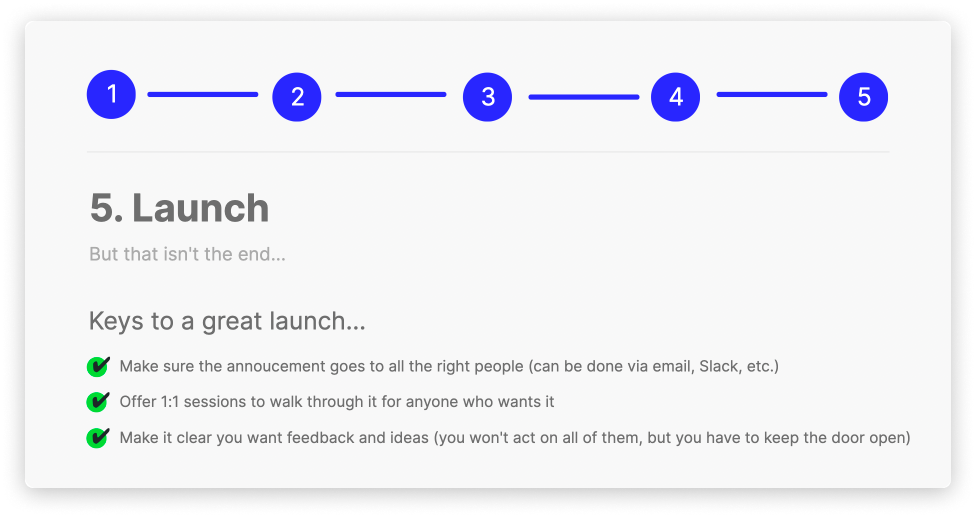
This can be done in either an email or slack message. I decided to go with a slack message and asked the team to schedule 1 to 1 sessions to go through it in more detail if they felt it was necessary.
Remember, the job is not finished, and like any great data project, continuous development is critical to ensure the canvas remains useful to the team. This is especially true for items that are designed for tracking key KPIs over periods of time and not a one-off analysis.
We have had a new employee join the team and they had lots of ideas for items they think would be great to include. We are working on a number of additions to the flow to give more context such as:
- Additional detail tabs for each KPI to get a historical view
- Actual vs Target in leads and MQL generation
- Additional Filters to focus on a specific type of leads (i.e Marketing Sourced vs Sales Sourced)
There you have it! A simple workflow to help you stay organized and focused on the end goal. The canvas is such a flexible workspace that it's tempting to get lost in the act of creation for its own sake. Following a structured workflow like this will keep things fun while getting you over the finish line!